
2.6-m Shajn Telescope
General Description |
|
|
The 2.6-m reflector (ZTSh), named after G.A.Shajn, is the second largest optical telescope in Russia. The telescope was manufactured in 1961 by Leningrad Optical-Mechanical Association (LOMO). The telescope has Prime, Nasmyth, Cassegrain and Coude foci. |
|
 |
 |
|
||||||||||
Instruments and detectors for observations of AGNs |
|
|
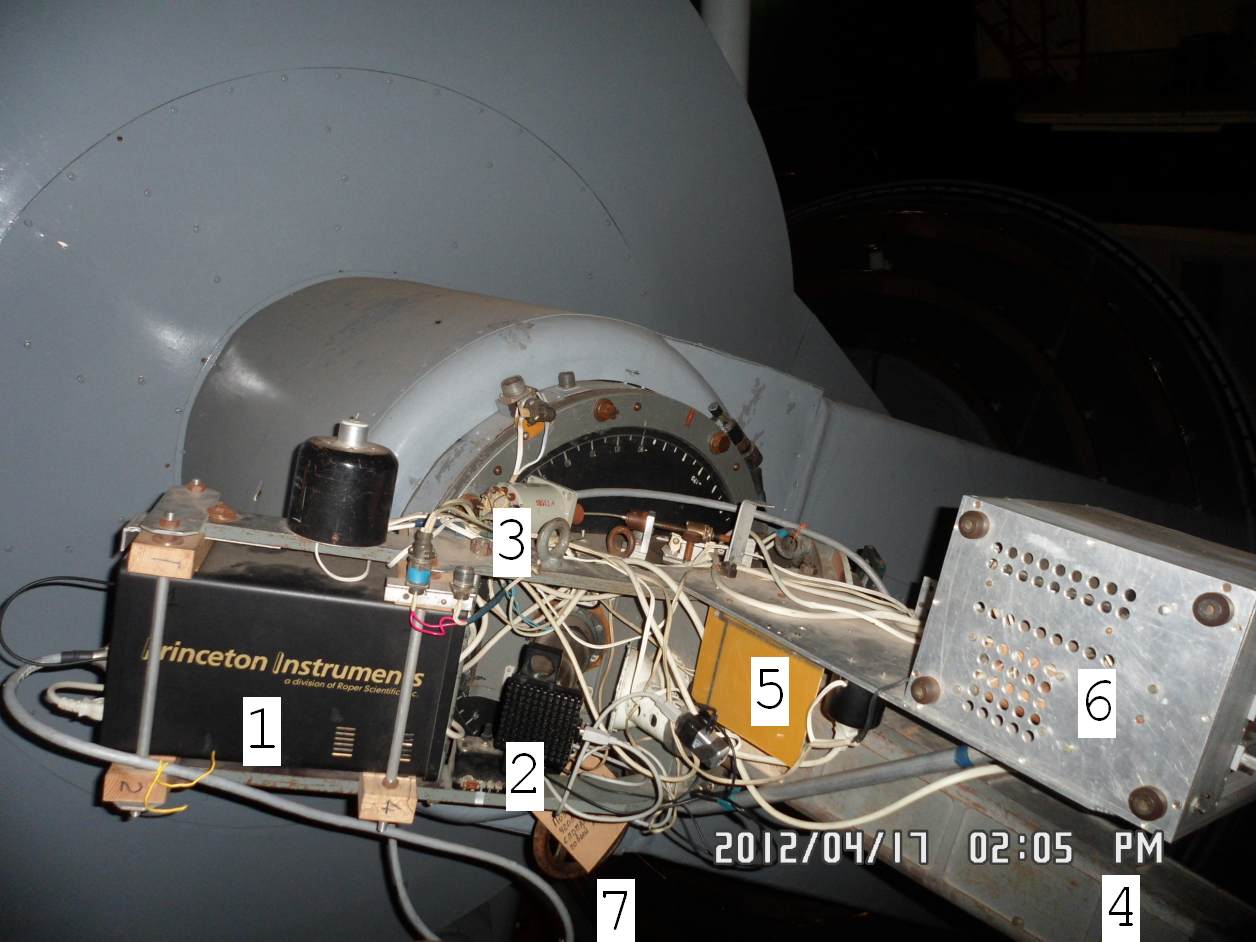
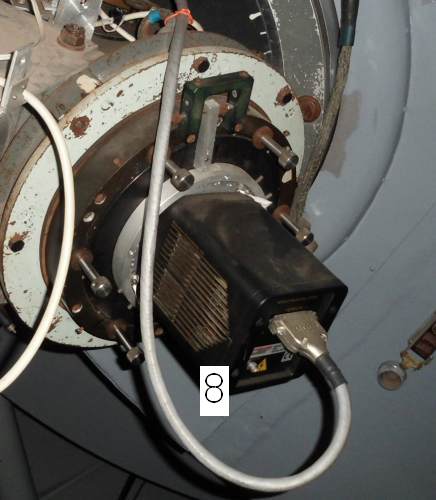
At present, the instrumental setup for spectral observations of AGNs includes a modern SPEC-10 CCD and the computer controlled spectrograph ("SPEM" spectrograph) mounted in the Nasmyth focus of the 2.6-m Shajn Telescope. The SPEC-10 CCD has been purchased under US Civilian Research and Development Foundation. |
|
||
|
"SPEM" spectrograph mounted in the Nasmyth focus of the 2.6-m Shajn Telescope.
|
|
||
|
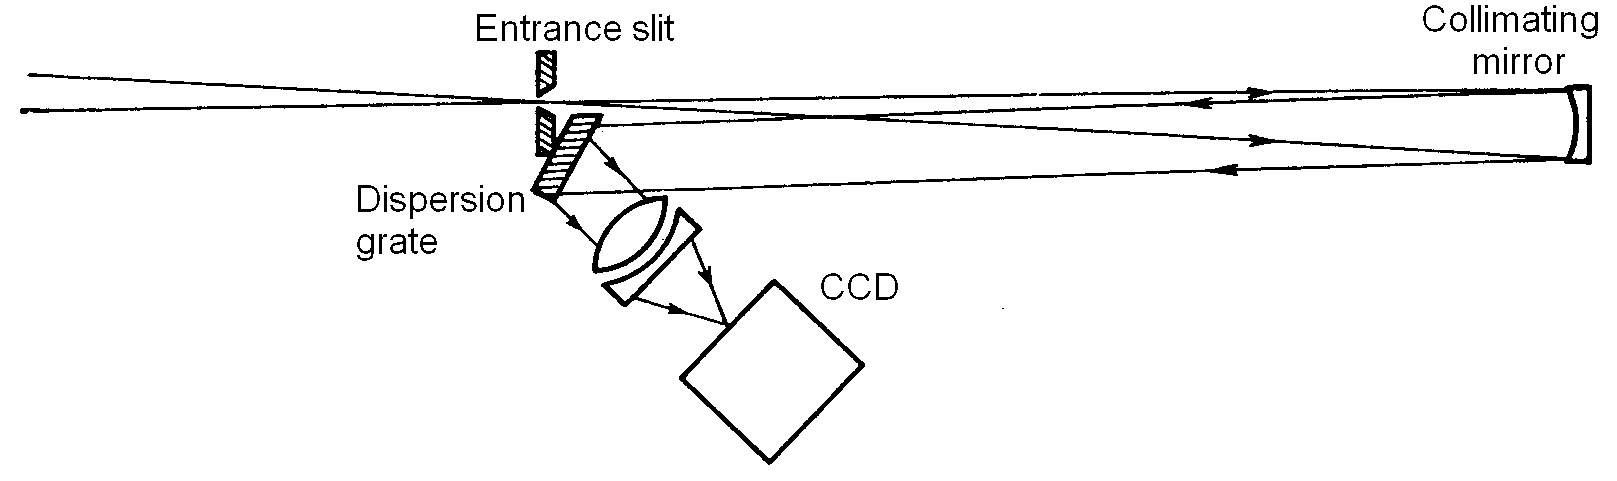
Optical scheme of the spectrograph "SPEM". |
|
||||||||||||||||
|
Characteristics of the SPEC-10 CCD camera. |
|
||||||||||
|
Characteristics of the Nasmyth focus spectrograph ("SPEM" spectrograph) with SPEC-10 CCD camera. |
Observations of AGNs |
||
|
Systematic observations of the emission lines in AGNs were initiated in the CrAO since 1972 by Chuvaev K.K., who is really pioneered spectroscopic monitoring of AGNs (Pronik & Chuvaev 1972; Chuvaev 1987; Chuvaev 1991). The AGN spectra were obtained with an image intensifier constructed in the USSR and a home-made high-transmission spectrograph (SPEM spectrograph) operating at the Nasmyth focus of the 2.6m telescope. The high sensitivity photographic films were used as detector. Chuvaev continued monitoring AGN spectra with this instrumental setup over 20 years up to 1991. |
||
|
The CCD observations of AGNs were initiated by V.I. Pronik who had developed a Cassegrain focus spectrograph for this purpose (the Pronik`s spectrograph). The first CCD spectra of AGNs were acquired in February 1988 by V.I. Pronik and S.G. Sergeev. During the next several years CCD observations of AGNs continued on a regular basis (usually once per month). The main target was the NGC 4151 nucleus (e.g., Sergeev 1994). |
||
|
The experience of these first AGN observations allowed us to identify the key sources of uncertainty in the CCD data (such as the seeing effect, the effect of atmospheric dispersion, etc.) as well as difficulties with the observational technique. As a result, the observation techniques as well as algorithms and software to process AGN spectra have been developed in the early 1990s for CCD observation of AGNs and these have not changed significantly up to the present. And of course, the quality of the CCD spectra has increased significantly. |
||
|
Intensive spectral monitoring over more than 13 years since November 1991 has been carried out with the SPEM spectrograph and Astro-550 CCD (see Berezin et al. 1991 for the specification of this CCD). A database containing more than 2500 CCD spectra for more than 20 AGNs was created with this CCD. |
||
|
Since July 2005, the instrumental setup for spectral observations of AGNs includes a modern SPEC-10 CCD and the computer controlled SPEM spectrograph. More than 1500 spectra of about thirty AGNs are obtained with this CCD. |
||
|
In the beginning of our AGN monitoring program with CCD, we had no more than one observational set (2-3 nights) per month and the entrance slit width was usually 2.0-2.3 arcsec. Since 1993, the observational rate has been increased up to 2 sets per month and the entrance slit width was set to 3 arcsec. The spectra were registered at the two separate spectral regions near Hβ and Hα lines. The ``extraction window'' was equal to 11 arcsec. The position angle was set to 90 degrees in most cases. Generally, most of the spectra in both spectral regions were obtained with a single exposure within a night, As a rule, four short-time (~5-30 sec) exposures of bright standard stars per each galaxy exposure have been obtained at approximately the same zenith distance. The spectral energy distribution for these stars has been taken from Kharitonov, Tereshchenko, & Knyazeva (1988). The standard star spectra were used to remove telluric absorption features from the AGN spectra as well as to provide the relative flux calibration. Using the standard stars, we have also measured the ``seeing'' defined as FWHM of the cross-dispersion profile on CCD image. The final flux calibration has been carried out by assuming the narrow emission line fluxes to be constant. |
|
||
|
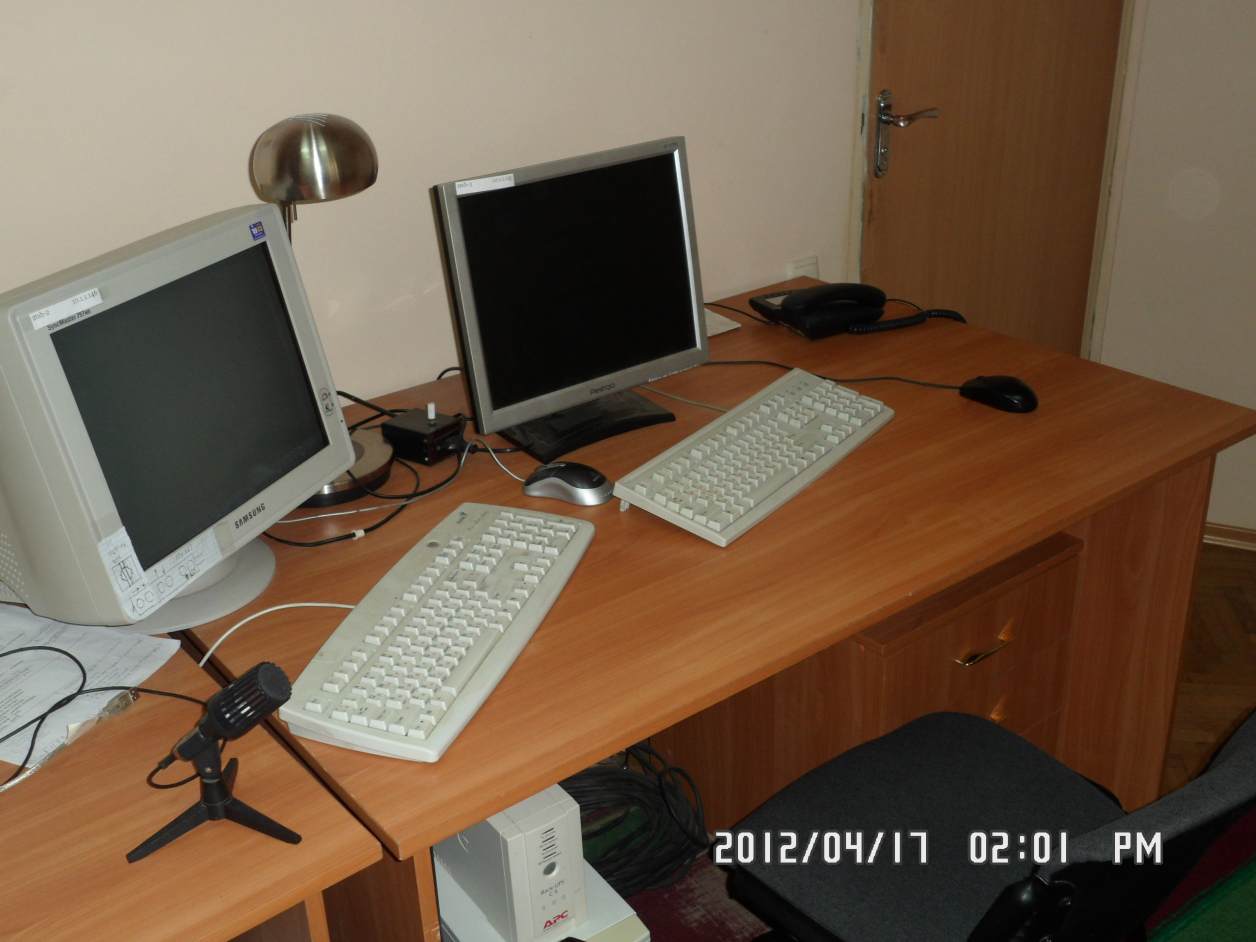
Observer room of the 2.6-m Shajn Telescope. Right: the computer to control SPEC-10 CCD camera and Nasmyth focus spectrograph to carry out the spectral observations of AGNs. Left: the computer to control MEADE CCD camera to view the focal plane of the entrance slit and to track targets. |
|
|||||||||||||||||||||||||||||||||||||||||||||||||||||||||||||||||||||||||||||||||||||||||||||||||||||||||||||||||||||||||||||||||||||||||||||||||||||||||||||||||||||||||||||||||||||||||||||||||||||||||||||||||||||||||||||||||||||||||||||||||||||||||||||||||||||||||||||||||||||||||||||||||||||||||||
|
Statistics for the spectral observations of AGNs. Given are only the targets that were observed on a regular basis. The number of nights of observations for each target is given in the following columns: (6): spectral observations with the Astro-550 CCD in 1991–2005; (7): spectral observations with the SPEC-10 CCD in 2005–2018. |
|||||||||||||||||||||||||||||||||||||||||||||||||||||||||||||||||||||||||||||||||||||||||||||||||||||||||||||||||||||||||||||||||||||||||||||||||||||||||||||||||||||||||||||||||||||||||||||||||||||||||||||||||||||||||||||||||||||||||||||||||||||||||||||||||||||||||||||||||||||||||||||||||||||||||||
Scientific results on AGN spectroscopy |
||
|
The program of the spectroscopic observations of the selected AGNs in the CrAO has the three major goals:
|
||
|
International cooperation: To obtain reliable estimates of the BLR sizes, central black hole masses, and other results, especially for the low luminosity AGNs with rapid variations, the International cooperation is strongly required. The Crimean Observatory participates in the International programs of spectroscopic and photometric monitoring of AGNs, such as AGN Watch or STORM (Space Telescope and Optical Reverberation Mapping), see for example, Peterson et al. (2002), Denney et al. (2010), Starkey et al. (2017), Kriss et al. (2019), which involves many various scientific institutions from various countries (USA, UK, Germany, Israel, and many others). Determination of the BLR size and black hole mass: The Crimean team takes part in the determination of the sizes and masses in total of fourteen AGNs (e.g., Denney et al. 2010; Grier et al. 2012). Due to efforts of the Crimean team only, there were first determined sizes and masses in the Mrk 6 and 1E 0754.6+3928 nuclei (Sergeev et al. 1999a, 2007; Doroshanko et al. 2012). Our reverberaion mapping results on the 3C 390.3 nucleus (Sergeev et al. 2002; 2011; 2017) suggest even larger black hole mass to its nucleus and, therefore, lower accretion rate than was previously thought and thus provides more evidence for anti-correlation between broad line widths and Eddington luminosity ratios (Sergeev et al. 2011; 2017). The reverberation BLR sizes and black hole masses allow to establish the most important relationships for AGNs: the size-luminosity and the mass-luminosity diagrams (Peterson et al. 2004; Bentz et al. 2009). These relationships are often considered in the frame of the AGN models. A link between the Hβ equivalent width, profile width, the BLR size and optical continuum luminosity have been investigated from a small sample of well studied AGNs. (Sergeev et al. 1999b). The radius-luminosity relation of r ~L0.7 and the mass-luminosity relation L~M1.9 have been claimed. Also, it was found a Baldwin effect in the Hβ line. Geometry and kinematics of gas in the BLR: Differences in the line-continuum lag among various line-of-sight velocities of the Hβ line profile (and for more lines such as Hα, Hγ, and He II λ4686Å in some cases) have been found for more than a dozen AGNs. For some AGNs, the 2-d Ψ(τ) reponse functions have been recovered. The obtained results indicate the complexity and variety of gas kinematics in the BLR, with a predominance of virial motion (Keplerian rotation) for most AGNs. Evidence has been obtained that the BLR is a multicomponent structure and that these components can be represented by disk and disk wind. Probably the kinematics of gas in AGN with broad double-peaked line profiles is a combination of Keplerian rotation and accretion (Sergeev et al. 1999a, 2001, 2020; Denney et al. 2009; Doroshenko et al. 2012; Grier et al. 2013; De Rosa et al. 2018). Long-term evolution of the broad line profiles: Several attempts have been undertaken by the Crimean team in order to understand the long-term evolution of the broad line profiles. An explanation of this evolution in the NGC 4151 nucleus has been given in terms of the multicomponent BLR which produces the two-component line profiles (Sergeev et al. 2001). For the Arp 102 B nucleus, the BLR was represented by a great number of gas clouds rotating predominantly in the same plane. This model explains double-peaked profiles of the Balmer lines as well as a drift motion of emission details along the line profile (Sergeev et al. 2000). Line-continuum correlations: The obtained results on the line-continuum relationships for the NGC 4151, NGC 5548, Mrk 6, 3C 390.3, and Ark 120 nuclei show that the response of the emission line fluxes to the continuum flux variations are undergoing long-term changes and these relationships are very different among the Hβ, Hα, and He II λ4686Å lines. In particular, for the 3C 390.3 nucleus, the power dependence Fline = Facont between the continuum fluxes (Fcont) and the line fluxes (Fline) has a power a equals to 0.54, 0.77, and 1.03 for the Hα, Hβ, and He II λ4686Å, respectively. So, the variability amplitude is the largest in the helium line, less in the Hβ, and more less in the Hα, which is consistent with the predictions of the photoionization models. Perhaps the response of the emission line fluxes to the continuum events of different durations is different as well. (Sergeev et al. 1994, 1999a, 2001, 2011, 2017, 2020; Malkov et al. 1997; Doroshenko et al. 2008, 2012). |
||
|
See also The goals and research problems. Scientific results. |
||