
Seyfert galaxies (optical)
Introduction |
|||
|
Active galactic nuclei (AGNs) are the brightest long-lived objects in the Universe, which emit a wide range of the electromagnetic spectrum from radio waves to gamma rays. According to the standard model of AGN there is a supermassive black hole with a mass of order 106–109 Solar mass at the centers of galaxies with active nuclei, surrounded by a bright accretion disk. The radiation of the accretion disk ionizes and heats surrounding gas, which emits broad spectral lines (so-called broad-line emission region or BLR). The black hole mass and accretion rate of gas into a black hole are the most important parameters that determine the structure and dynamics of AGN. A narrow relativistic jet from the central parts of the accretion disk is the source of synchrotron radiation. The magnetic field controls almost all of the basic physical processes in jets. Because the extremely small angular size of active nuclei, their structure can not be seen directly, and it can only be determined by indirect methods by observing radiation of AGN and the variability of this radiation at different wavelength ranges. |
|||
History of AGNs research in the Crimean Astrophysical Observatory |
|||
|
Traditionally, Crimean Astrophysical Observatory takes one of the leading positions in the world in the study of AGN and carries out research in this field since 1960s. E.A. Dibai and V.I. Pronik began their studies of physical conditions in nuclei of Seyfert galaxies in 1964. Their works were pioneering at that time with observations carried out using a high-speed spectrograph at the 1.2-m telescope of the Crimean Station of SAI. Analysis of the spectra allowed them to make a conclusion about the presence of the two subsystems (two zones) of gas in the nuclei of Seyfert galaxies ( Dibai & Pronik 1967). These zones are called broad-line region (BLR) and narrow-line region (NLR). K.K. Chuvaev was the first in the world who started systematic spectroscopic observations (monitoring) of the selected AGNs in 1972 with the 2.6-m Shajn Telescope, thus becoming a pioneer of the spectral monitoring of AGNs. The observations were carried out with the "SPEM" spectrograph (see Krymskaia Astrofizicheskaia Observatoriia, Izvestiia, vol. 36, 1967, p. 277-280. in Russian) specially designed and manufactured in the Crimean Astrophysical Observatory for the the Nasmyth focus of the telescope. More than 20 AGNs were observed over the 20-years period. The results of longterm observations of Hβ and [OIII] 5007Å line profiles and their intensities in NGC 7469, NGC 5548, NGC 4151, NGC 1275, 3C 120 and others were published in a series of papers by K.K. Chuvaev and his colleagues: Doroshenko et al. (1976), Chuvaev (1980), Lyutyj et al. (1984), Chuvaev (1985, 1987, 1991) and other. Photoelectric monitoring of AGNs was first performed with the 1.25-m telescope of CrAO in 1982 using the photoncounting scanning spectrometer (e.g., Merkulova 1986). Since 1989 simultaneous UBVRI observations of selected Seyfert galaxies were carried out with the 1.25-m AZT-11 Telescope at CrAO by N.I. Merkulova and L.P. Metik using the five-channel Double Image Chopping Photometer-Polarimeter developed by Prof. Piirola (e.g., Merkulova & Metik 1993, 1996; Merkulova et al. 1999; Merkulova 2000). In 1983, the Crimean Astrophysical Observatory started its space program: the "Astron" ultraviolet space observatory with the 80-cm telescope on board was launched from the Baikonur Cosmodrome. The 80-cm telescope was manufactured in the Crimean Astrophysical Observatory. This space observatory has successfully worked for about seven years, observing various UV sources including AGNs. The results of observations of AGNs have been published in several papers (e.g., Merkulova et al. 1990). Big step toward understanding the AGN phenomena has been done when the obsolete detectors at the 2.6-m Shajn Telescope have been replaced with CCDs. The CrAO was a pioneer of CCD observations among the astronomical institutes of the Soviet Union. Spectral observations with the Astromed-2000 CCD were started at the 2.6-m Shajn Telescope in 1985. The first CCD spectra of AGNs were acquired in February 1988 by V.I. Pronik and S.G. Sergeev (Sergeev 1990, 1991, 1992, 1994a, etc.). During the next several years CCD observations of AGNs continued on a regular basis (usually once per month). Intensive spectral monitoring over more than 13 years since 1991 were carried out with the Astro-550 CCD. NGC 4151, NGC 5548, NGC 7469, Mrk 6, Arp 102B, 3C 390.3, and some other AGNs were studied by K. Chuvaev, Yu. Malkov, V. Pronik, and S. Sergeev (e.g., Malkov et al. 1997; Sergeev et al. 1999a, 2000, 2001, 2002, 2007b). A database containing more than 2500 CCD spectra of AGNs was created (see here). Finally, in 2001 the BVRI CCD photometer on the basis of AP7p CCD camera has been set in the prime focus of the 70-cm telescope AZT-8, and in 2005 the old Astro-550 CCD camera has been replaced with a new SPEC-10 CCD camera. Both new cameras were purchased under US Civilian Research and Development Foundation (CRDF). By present, there were obtained a lot of observing data with the new SPEC-10 camera, even more than with the old one (see here). In 1988, when the first CCD spectra of AGNs were obtained, our main scientific goals were to study the long-term (years and decades) variability of the profiles of the broad spectral lines, and to check the rapid variability of the narrow lines, the possibility of which was intensively discussed in the Crimean Astrophysical Observatory at that time. In the next years, the problem of the variability of the narrow lines has become a secondary task, while new scientific goals have arisen: determining the size of the broad emission-line regions and the masses of the central black holes by the reverberation mapping method, analysis of correlations between the properties of the spectral lines and continuum, and some others (detailed description of our scientific goals is below). |
|||
| Go to content | |||
Observations of AGN |
|||
|
The telescopes of the Crimean Astrophysical Observatory are used to carry out a systematic photometric, spectral, and polarization studies of a sample of several dozens of AGNs. Optical observations of AGNs at the Crimean Astrophysical Observatory are carried out basically on the two telescopes: on the 70-cm AZT-8 telescope (photometric observations), and on the 2.6-m Shajn Telescope (spectral observations). Instruments and detectors, as well as the method of observations are described in the above references for these telescopes. In addition to the internal observational programs, the Crimean Astrophysical Observatory participates in the International observations of AGNs, including observations from the space-based observatories (the International Ultraviolet Explorer and the Hubble Space Telescope, for example: Korista et al. 1995, Onken et al. 2007). |
|||
| Go to content | |||
The goals and research problems. Scientific results. |
|||
|
The aim of AGN researches carried out at the Crimean Astrophysical Observatory is a comprehensive study of the structural features in the immediate vicinity of supermassive black holes:
A lot of the works are done in close international cooperation among scientists from many countries of the world. |
|||
|
The size, geometry, kinematics of the BLR, and the mass of the central black holes are determined from the time delay in flux changes of the spectral lines (and individual sections of the specral lines) to the continuum using a so-called reverberation-mapping method. Factors that interferes with the determination of the time delay with high accuracy are: (i) "Gaps" in the light curves due to weather conditions, (ii) "Gaps" due to lack of the observing time, and (iii) too low variability amplitude of the observed object during the observation period. Therefore, international cooperation involving many observatories is particularly important to achieve this goal. Also important for this problem are simultaneous observations from the space-based observatories, where no "gaps" exists due to weather conditions and where it is possible to observe in wavelengths ranges that are inaccessible from the Earth. Our observing program mainly designed for the AGNs with moderate and high absolute luminosity, for which observations with a time resolution of order of ten to twenty days are sufficient to determine the time delay. The method of reverberation-mapping is the most direct method of determination the masses of black holes in AGNs. It is based on the study of the dynamics of gas emitting the broad lines in the BLR (see here). Scientific goals: (i) To obtain estimates of the BLR sizes and masses of the central black holes for several AGNs by the reverberation-mapping method, possibly extending the range of absolute luminosities and types of AGNs; (ii) To determine the kinematics of gas in the BLR for more and more AGNs; (iii) To explore how BLR kinematics obtained from observations of circumnuclear gas is related to the case when the main force in the movement of gas is the gravity of the central black hole. This is directly related to the accuracy of the determination the masses of the central black holes in AGNs by the reverberation mapping; (iv) To compare mass estimates obtained by the method of reverberation-mapping with the estimates obtained by other methods. |
|||
| Most important scientific results: | |||
|
BLR sizes and masses of the central black holes were first determined or refined for a number of AGNs by the reverberation mapping. This work is carried out in the framework of independent research as well as in close International cooperation. In particular, in the framework of International cooperation with foreign colleagues from the United States, Israel, and other countries much more reliable estimates of the BLR sizes and masses of the central black holes for the nuclei of NGC 4051, NGC 3227, NGC 3516, NGC 5548, Mrk 335, 3C 120, PG 2130+099 galaxies were obtained. For the Mrk 817, Mrk 1501 and Mrk 290 galaxies the sizes and masses have been determined for the first time. In the framework of independent studies, we have determined the sizes and masses for the nuclei of the following galaxies: NGC 4151 (Sergeev 1994a), Mrk 6 (Sergeev et al. 1999a, 1999b; Doroshenko et al. 2012), Ark 120 (Doroshenko et al. 2008), Arp 102B (Sergeev et al. 2000), 3C 390.3 (Sergeev et al. 2002, 2011, 2017), and 1E 0754.6+3928 (Sergeev et al. 2007b). The masses of the black holes for several AGNs have been determined in Sergeev et al. (1999b). For Mrk 6, Arp 102B, and 1E 0754.6+3928 galaxies these estimates were made for the first time. The results of measurement of the sizes and masses are summarized in Table 1. |
|||
| Table 1: Estimates of the BLR sizes and masses of the central black holes assuming a scaling factor which converts the virial product to a mass to be f=5.5. | ||||
|
||||
|
For the first time, a big step toward determination the kinematics of BLR has been made from the variability of the broad lines and continuum. There were obtained estimates of the time delay at different line-of-sight velocities of the Hβ line profile for several AGNs. For some of these AGNs, the transfer functions y were restored. In particular, for the 3C 120 nucleus, it was found that the kinematics of BLR is consistent with both the inclined disk and infalling gas, but the results obtained from the He II λ4686Å are only consistent with the infall. Hydrogen lines in the nucleus of Mrk 335, Mrk 1501, and PG 2130+099 show signs of infalling gas, but the He II λ4686Å line in Mrk 335 is only consistent with the inclined disk. BLR kinematics in Mrk 6 is probably a combination of both the disk and infalling gas, while BLR kinematics in NGC 5548 is consistent with the Keplerian rotation. The obtained results suggest the complexity and diversity of the gas motion in the BLR and they are put significant observational constraints on the scale factor f, which is necessary for determination the masses of the central black holes by the reverberation mapping. Evidence has been obtained that the BLR is multicomponent and that these components can be represented by disk and disk wind. Probably the kinematics of gas in AGN with broad double-peaked line profiles is a combination of Keplerian rotation and accretion (Sergeev et al. 1999b, 2020; Denney et al. 2009; Doroshenko et al. 2012; Grier et al. 2013; Pei et al. 2017; De Rosa et al. 2018). For the first time, from the He II λ4686Å line, there was obtained a reliable estimate of the BLR size of and the mass of the central black hole for AGN of the NLS1-type. The size of the emission region of this line was found to be much smaller than of the Hβ line. The mass estimates from both lines are in a good agreement (Grier et al. 2012b). It is shown that the size of the broad line region r in the NGC 5548 nucleus changes with luminosity L of the nucleus as: r ~ L0.5. This confirms the previously observed virial relationship between time delay and the line width, which indicates the gravitionally dominated gas motion in BLR (Bentz et al. 2007). |
||||||||||||
| Go to section top Go to content |
||||||||||||
|
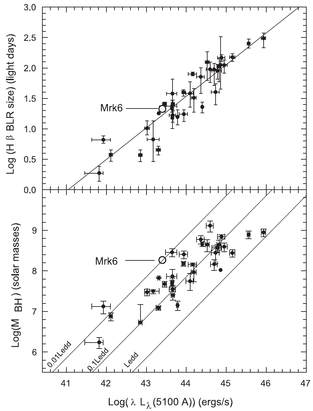
The "size-luminosity" and "mass-luminosity" dependences. The observed relationships between the size of the BLR, the central black hole mass, and the absolute luminosity of nuclei are often associated with the development of various AGN models, so the study of these relationships is a very important issue. The high degree of correlation of the "size-luminosity" relationship allows us to estimate the BLR size from the nucleus luminosity and to obtain the mass of the black hole from a single spectrum (a so-called "single-epoch spectrum" method). A position of a given AGN on the "mass-luminosity" relationship depends (except for the orientation effect of the accretion disk and measurement uncertainties) on the accretion rate onto the black hole, which allows us to estimate this rate in various AGNs. More luminous nuclei under a given mass of the black hole have the accretion rate closer to the maximum possible limit. Scientific goals: On the basis of new estimates of the BLR sizes and the masses of the central black holes for a growing number of AGNs to refine the "size-luminosity" and "mass-luminosity" diagrames, and to study the positions of individual types of AGNs on these diagrams. |
||||||||||||
| The most important scientific results: | ||||||||||||
|
It was found that the NLS1-type AGNs reside on the bottom edge of the "mass-luminosity" diagram, which corresponds to an increased rate of gas accretion onto a black hole in this type of AGNs, which is close to the maximum possible limit for a given mass (called the Eddington limit). On the other hand, the AGNs with broad double-peaked profiles of the hydrogen lines (such as 3C 390.3) reside on the upper edge of the "mass-luminosity" diagram and such AGNs have a very low accretion rate for a given luminosity (Sergeev et al. 2007b, 2011; 2017; Doroshenko et al. 2012). The power-law indices for the "size-luminosity" and "mass-luminosity" dependences were determined (Sergeev et al. 1999b). After refining the black hole mass and the BLR size of the NGC 4051 nucleus, this nucleus is no longer the most deviating object from the general dependence on the "radius-luminosity" diagram (Denney et al. 2009). The scatter in the "size-luminosity" diagram was considerably reduced in the low luminosity region (Denney et al. 2010). |
||||||||||||
|
||||||||||||
| Go to section top Go to content |
||||||||||||
|
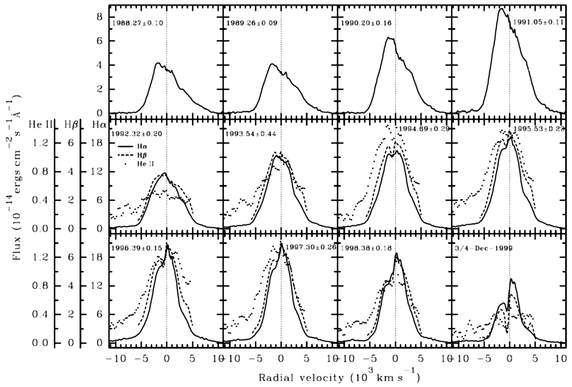
Long-term (years and decades) evolution of the broad-line profiles. Broad emission line profiles in active galactic nuclei reflect the geometric structure, kinematics, and physical conditions in the spatially unresolved broad-line region (BLR). These profiles exhibit a wide range of characteristics: various widths, redward and blueward asymmetries, bumps, and shelves. In addition, the broad emission lines are strongly variable in flux as well as in shape as observed from 70-s of the last century. To explain the variability of the profile shapes of these lines, there were discussed the following BLR models: (i) Double black hole, each with its BLR; (ii) A small number of large gas clouds orbiting the black hole and illuminated by the collimated beam from the central source; (iii) biconical outflow; (iv) The disk model of BLR with inhomogeneities in the disk surface brightness; (v) multi-component BLR model. Monitoring the flux and profile variations of the broad emission lines is therefore important in order to distinguish among various proposed BLR models and to understand the nature of the BLR. Scientific goals: To carry out a long-term spectral monitoring of selected AGNs. To study the nature and regularities of the observed variability of the broad-line profiles and their consistency the proposed BLR models on the basis of these monitoring. |
||||||||||||
| The most important scientific results: | ||||||||||||
|
It was first applied a statistical approach to analyze the variability of profile shapes of the broad emission lines in AGNs. In this approach, the statistical regularities of variability expected from a given BLR model are compared with the observed regularities in order to confirm or to reject this model (Sergeev et al. 2000). To explain the variability of the broad-line profiles in the Arp 102B nucleus, it was proposed a model of BLR in the form of a relatively small number of large clouds rotating predominantly in the same plane around the black hole (Sergeev et al. 2000). A two-component BLR model is developed. It was found that this model explains the observed variability of the broad-line profiles for some AGNs and for limited time intervals. However, this model does not work well at longer time intervals (over decades) and it can be applied only for some AGNs (Sergeev et al. 1994b; Malkov et al. 1997; Sergeev et al. 2001). It was confirmed that the changes of shapes of the broad lines profiles occur independently on the continuum flux. In particular, the line widths depend weakly on the nucleus luminosity. It is concluded that the BLR is a stable formation which does not change their physical and kinematic properties for at least decades (Sergeev et al. 2007a). It was found that both the total flux of He II λ4686Å line and the profile of this line show variability patterns very different from that of the hydrogen lines (Sergeev et al. 2001). |
||||||||||||
|
||||||||||||
| Go to section top Go to content |
||||||||||||
|
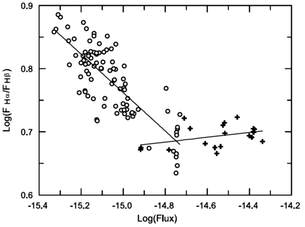
The line-continuum correlation. Photoionization nature of the broad emission lines in the BLR suggests that there should be a close relationship between the properties of these lines and the properties of the continuum. The observed correlations of this kind should help to check the mechanisms of formation of the emission lines and to get parameters of the photoionization models of BLR. |
||||||||||||
| The most important scientific results: | ||||||||||||
|
The empirical dependences and regularities of variability of the broad lines and continuum emission in AGNs are derived. They can be used to construct a models of the broad-line emission region. In particular:
|
||||||||||||
|
||||||||||||
| Go to section top Go to content |
||||||||||||
|
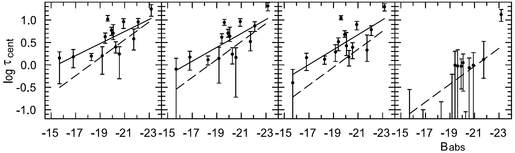
The Reprocessing model. To explain the observed correlation between changes in the X-ray, ultraviolet, and optical fluxes of AGNs, there was widely considered a so-called thermal reprocessing model, in which the accretion disk radiates not only due to viscous friction, but mostly due to heating by X-rays. Scientific goals: To obtain from the observational data some accretion disk parameters by using the reprocessing model. To do so, it is necessary to determine lags between flux variations in various spectral bands from X-rays to near infrared for many AGNs and to compare the available infrared, optical, ultraviolet, and X-ray observational data with the model computations. |
||||||||||||
| The most important scientific results: | ||||||||||||
|
From a sample of 14 AGNs it is discovered a lag between flux changes in the photometric bands B, V, R and I, and it is shown that this time delay is consistent with the reprocessing model. It is found a dependence between the lag τ and the luminosity of the nucleus L: τ ~ Lb, where b ≈ 0.4–0.5. These results and observational data were used by other authors in several papers. The time delay can be used to compute the absolute luminosity of AGNs, and, therefore, it has an important cosmological aspect (Sergeev et al. 2005, 2006). Similar results for three more AGNs were obtained by Sergeev (2014). Within the reprocessing model it is simulated the optical light curves of Mrk 79 and NGC 4051 on the basis of the observed X-ray light curve. It is shown that the model is in a good agreement with the observations of the Mrk 79 nucleus when there are long-term (from year to year) changes in the accretion rate of gas into a black hole or changes in the height of the X-rays source, and with observations of the NGC 4051 nucleus when a part of the optical radiation is emitted in a more extended system than the accretion disk. The lag between the optical and X-ray flux variations in both nuclei agree with the lag expected from the reprocessing model. For NGC 4051 the lag was found to be significantly greater than zero, i.e., the optics lags behind the X-ray as expected from the model (Breedt et al. 2009, 2010). A comparison of the characteristics of the optical and X-ray variability of AGNs is made and it is shown that X-ray variability occurs on shorter time scales, while the optical light curves often have a long-term trend, which is not seen in the X-ray light curve. This is seen from the narrow width of the autocorrelation function and from the less power index of the structure function for X-rays. Long-term trends in optics may cause the relative rms amplitude changes be even greater than that of the X-ray amplitude. However, the ratio of maximum to minimum fluxes is always greater for X-rays than for optics (Sergeev 2008; Breedt et al. 2009; Chesnok et al. 2009; Doroshenko et al. 2009, 2010). In terms of the international STORM program (Space Telescope and Optical Reverberation Mapping Project) there have been estimated some accretion disk parameters in the NGC 5548 nucleus. Observational data have been obtained from both the ground-based and space observatories (Hubble Space Telescope, Swift). The disk radius was found to be 0.35±0.05 light days at wavelength of 1367Å. By comparing the variability at many wavelength ranges from X-rays to near infrared, the accretion disk model in this nucleus has been constructed. This model yields the disk inclination i=36±10° (i=0° for the face-on geometry), temperature T=(44±6°)×103K at 1 light day from the black hole, and a temperature-radius relationship of T ~ r –0.99±0.03 (Fausnaugh et al. 2016; Starkey et al. 2017 ). In terms of the International cooperation, the sizes of the accretion disks in two AGNs were determined. The determined sizes consistent with geometrically thin accretion-disk models that predict a lag-wavelength relation of t4/3, however, they are by 2-3 times greater than that expected from the standard model. The agreement can be achieved by increasing the accretion rate. (Fausnaugh et al. 2018). |
||||||||||||
|
||||||||||||
| Go to section top Go to content |
||||||||||||